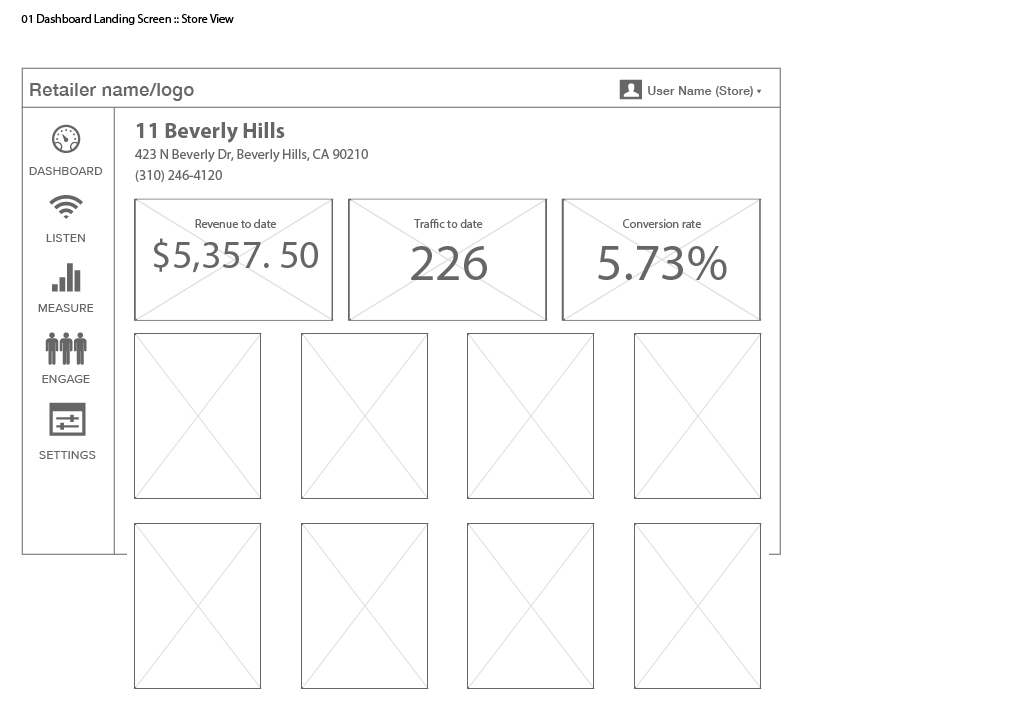
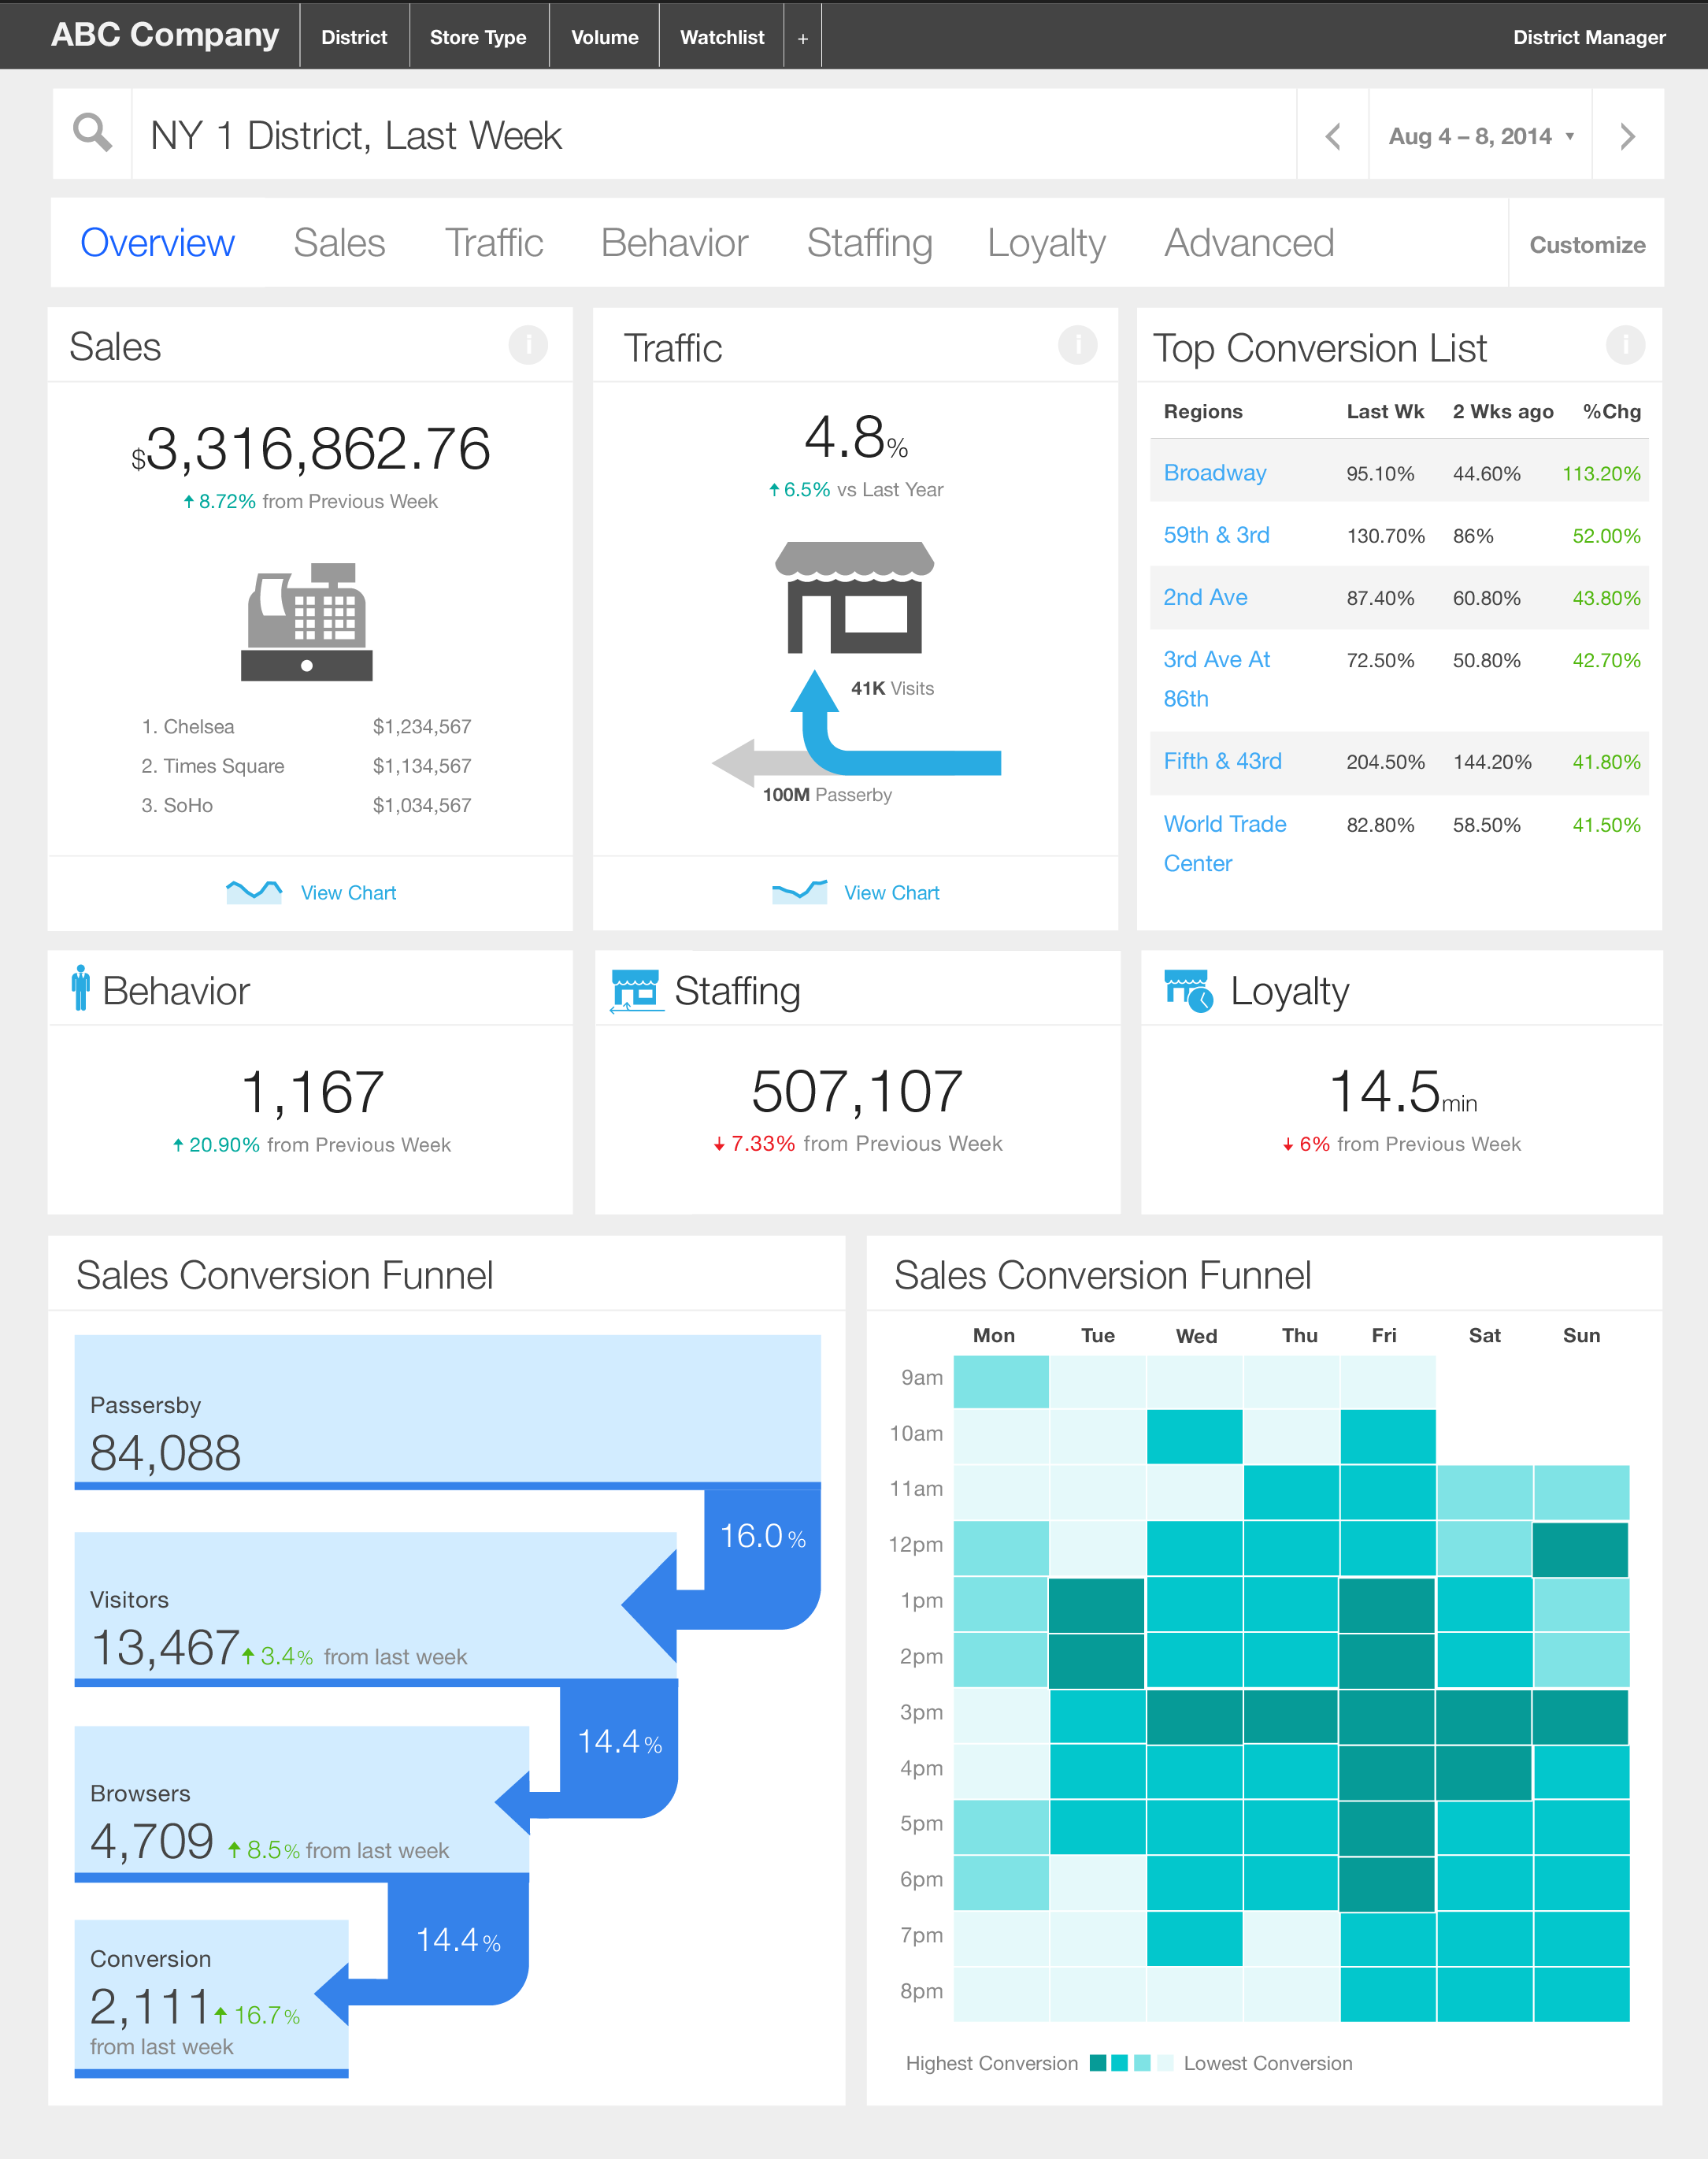
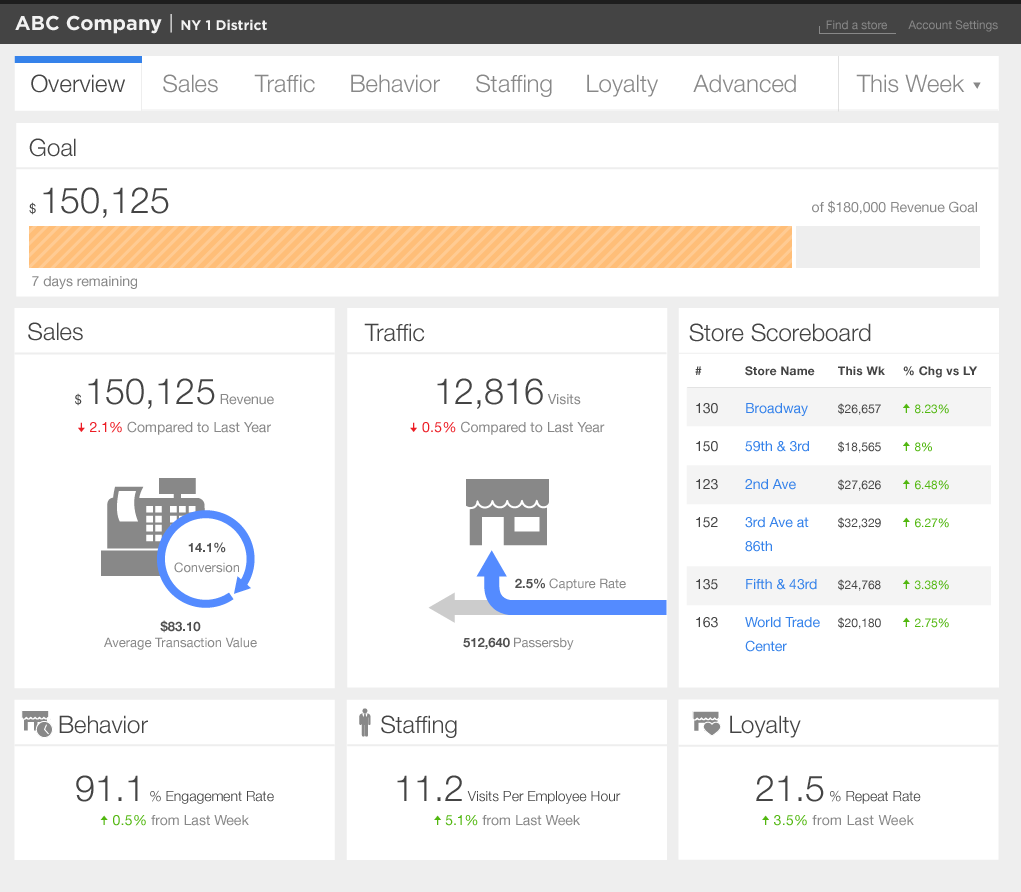
The Listen Grid was my initial attempt to organize the data we collect in a manner that our users would be able to view & manipulate it. After a year, we learned a lot about our users and how they use our product. They needed their associates to be able to analyze the data we collect without spending too much time on it. We then came up with reports that made the data we have more digestible.
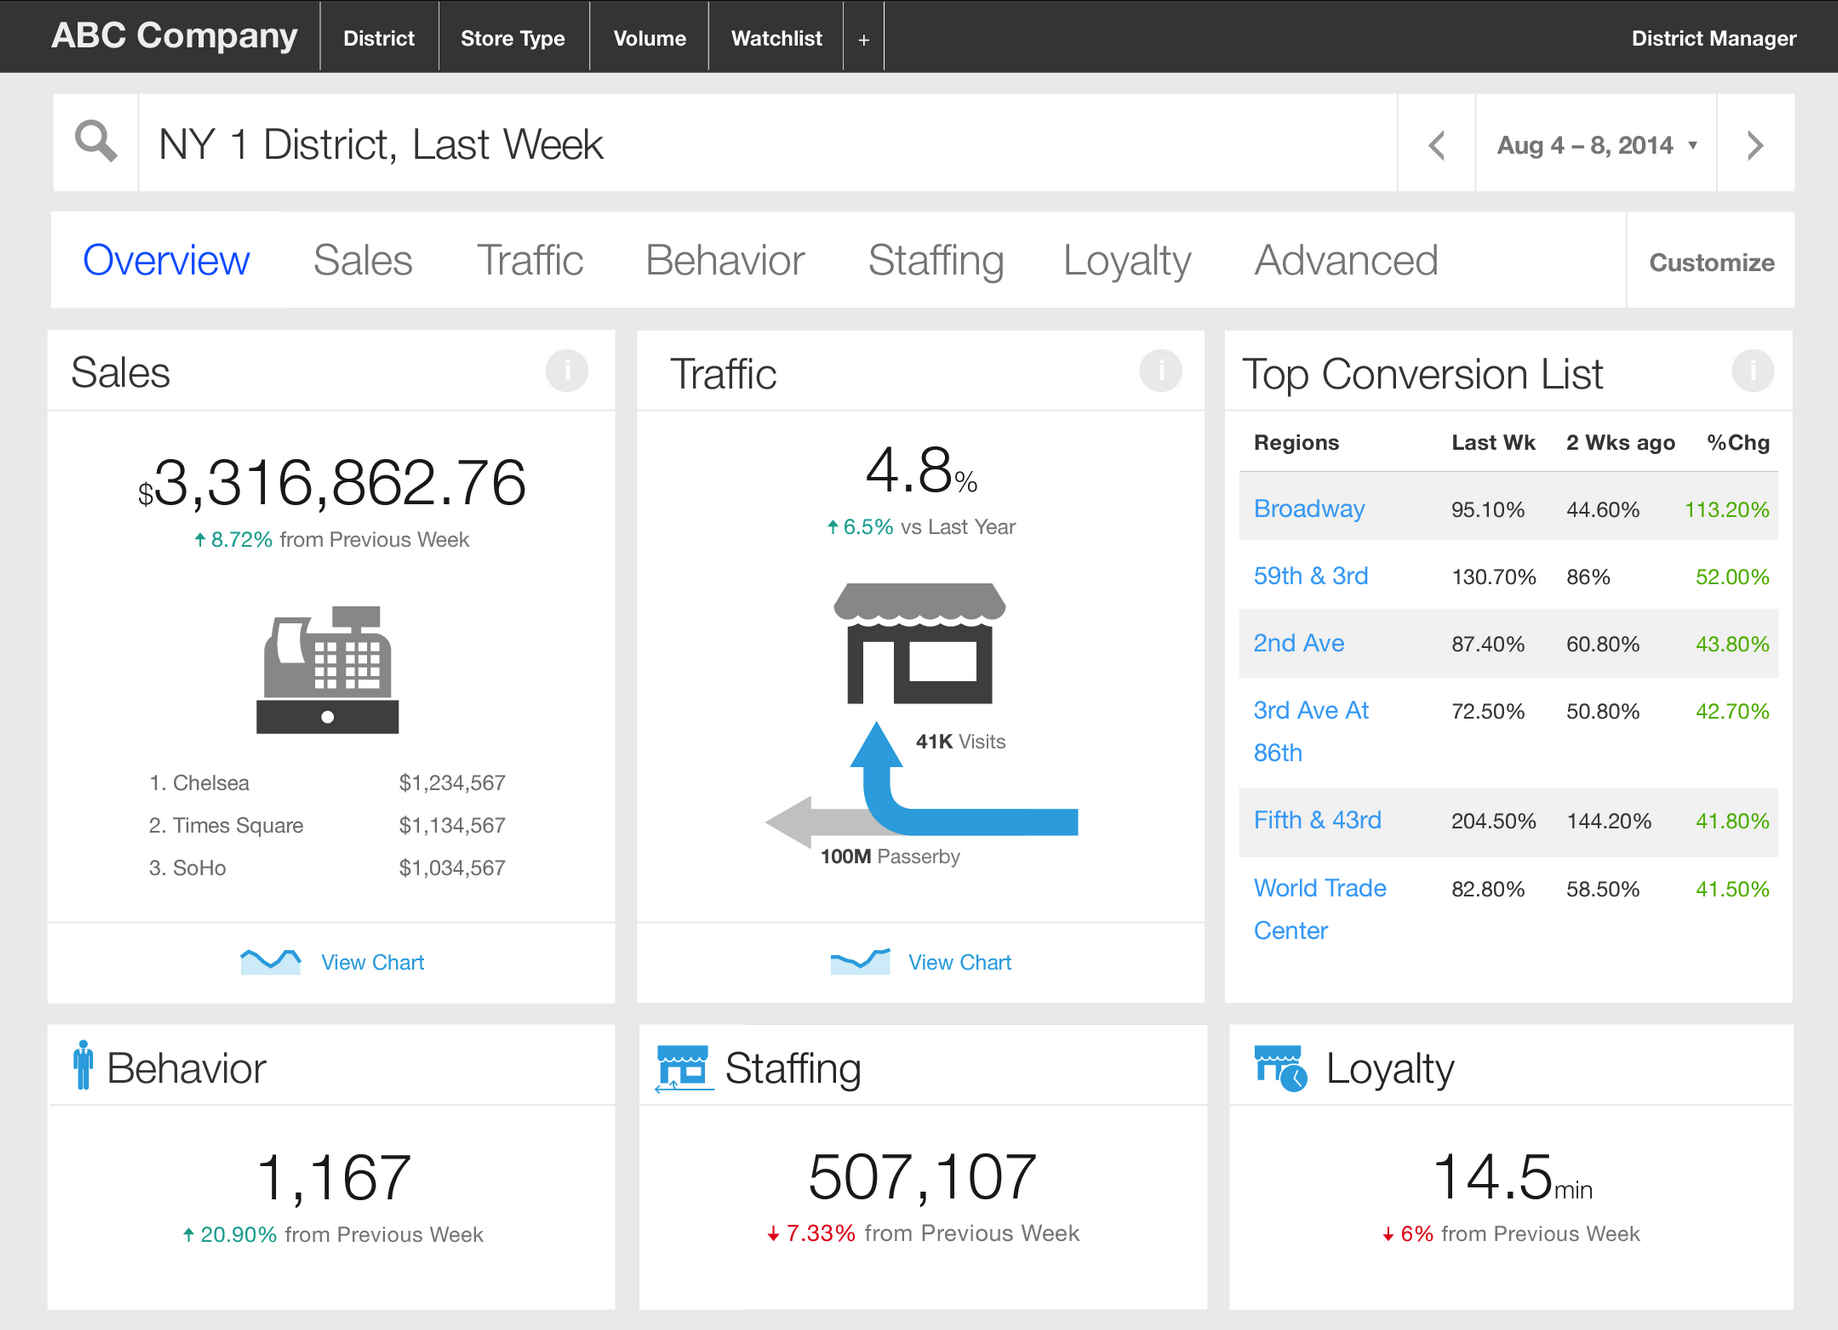
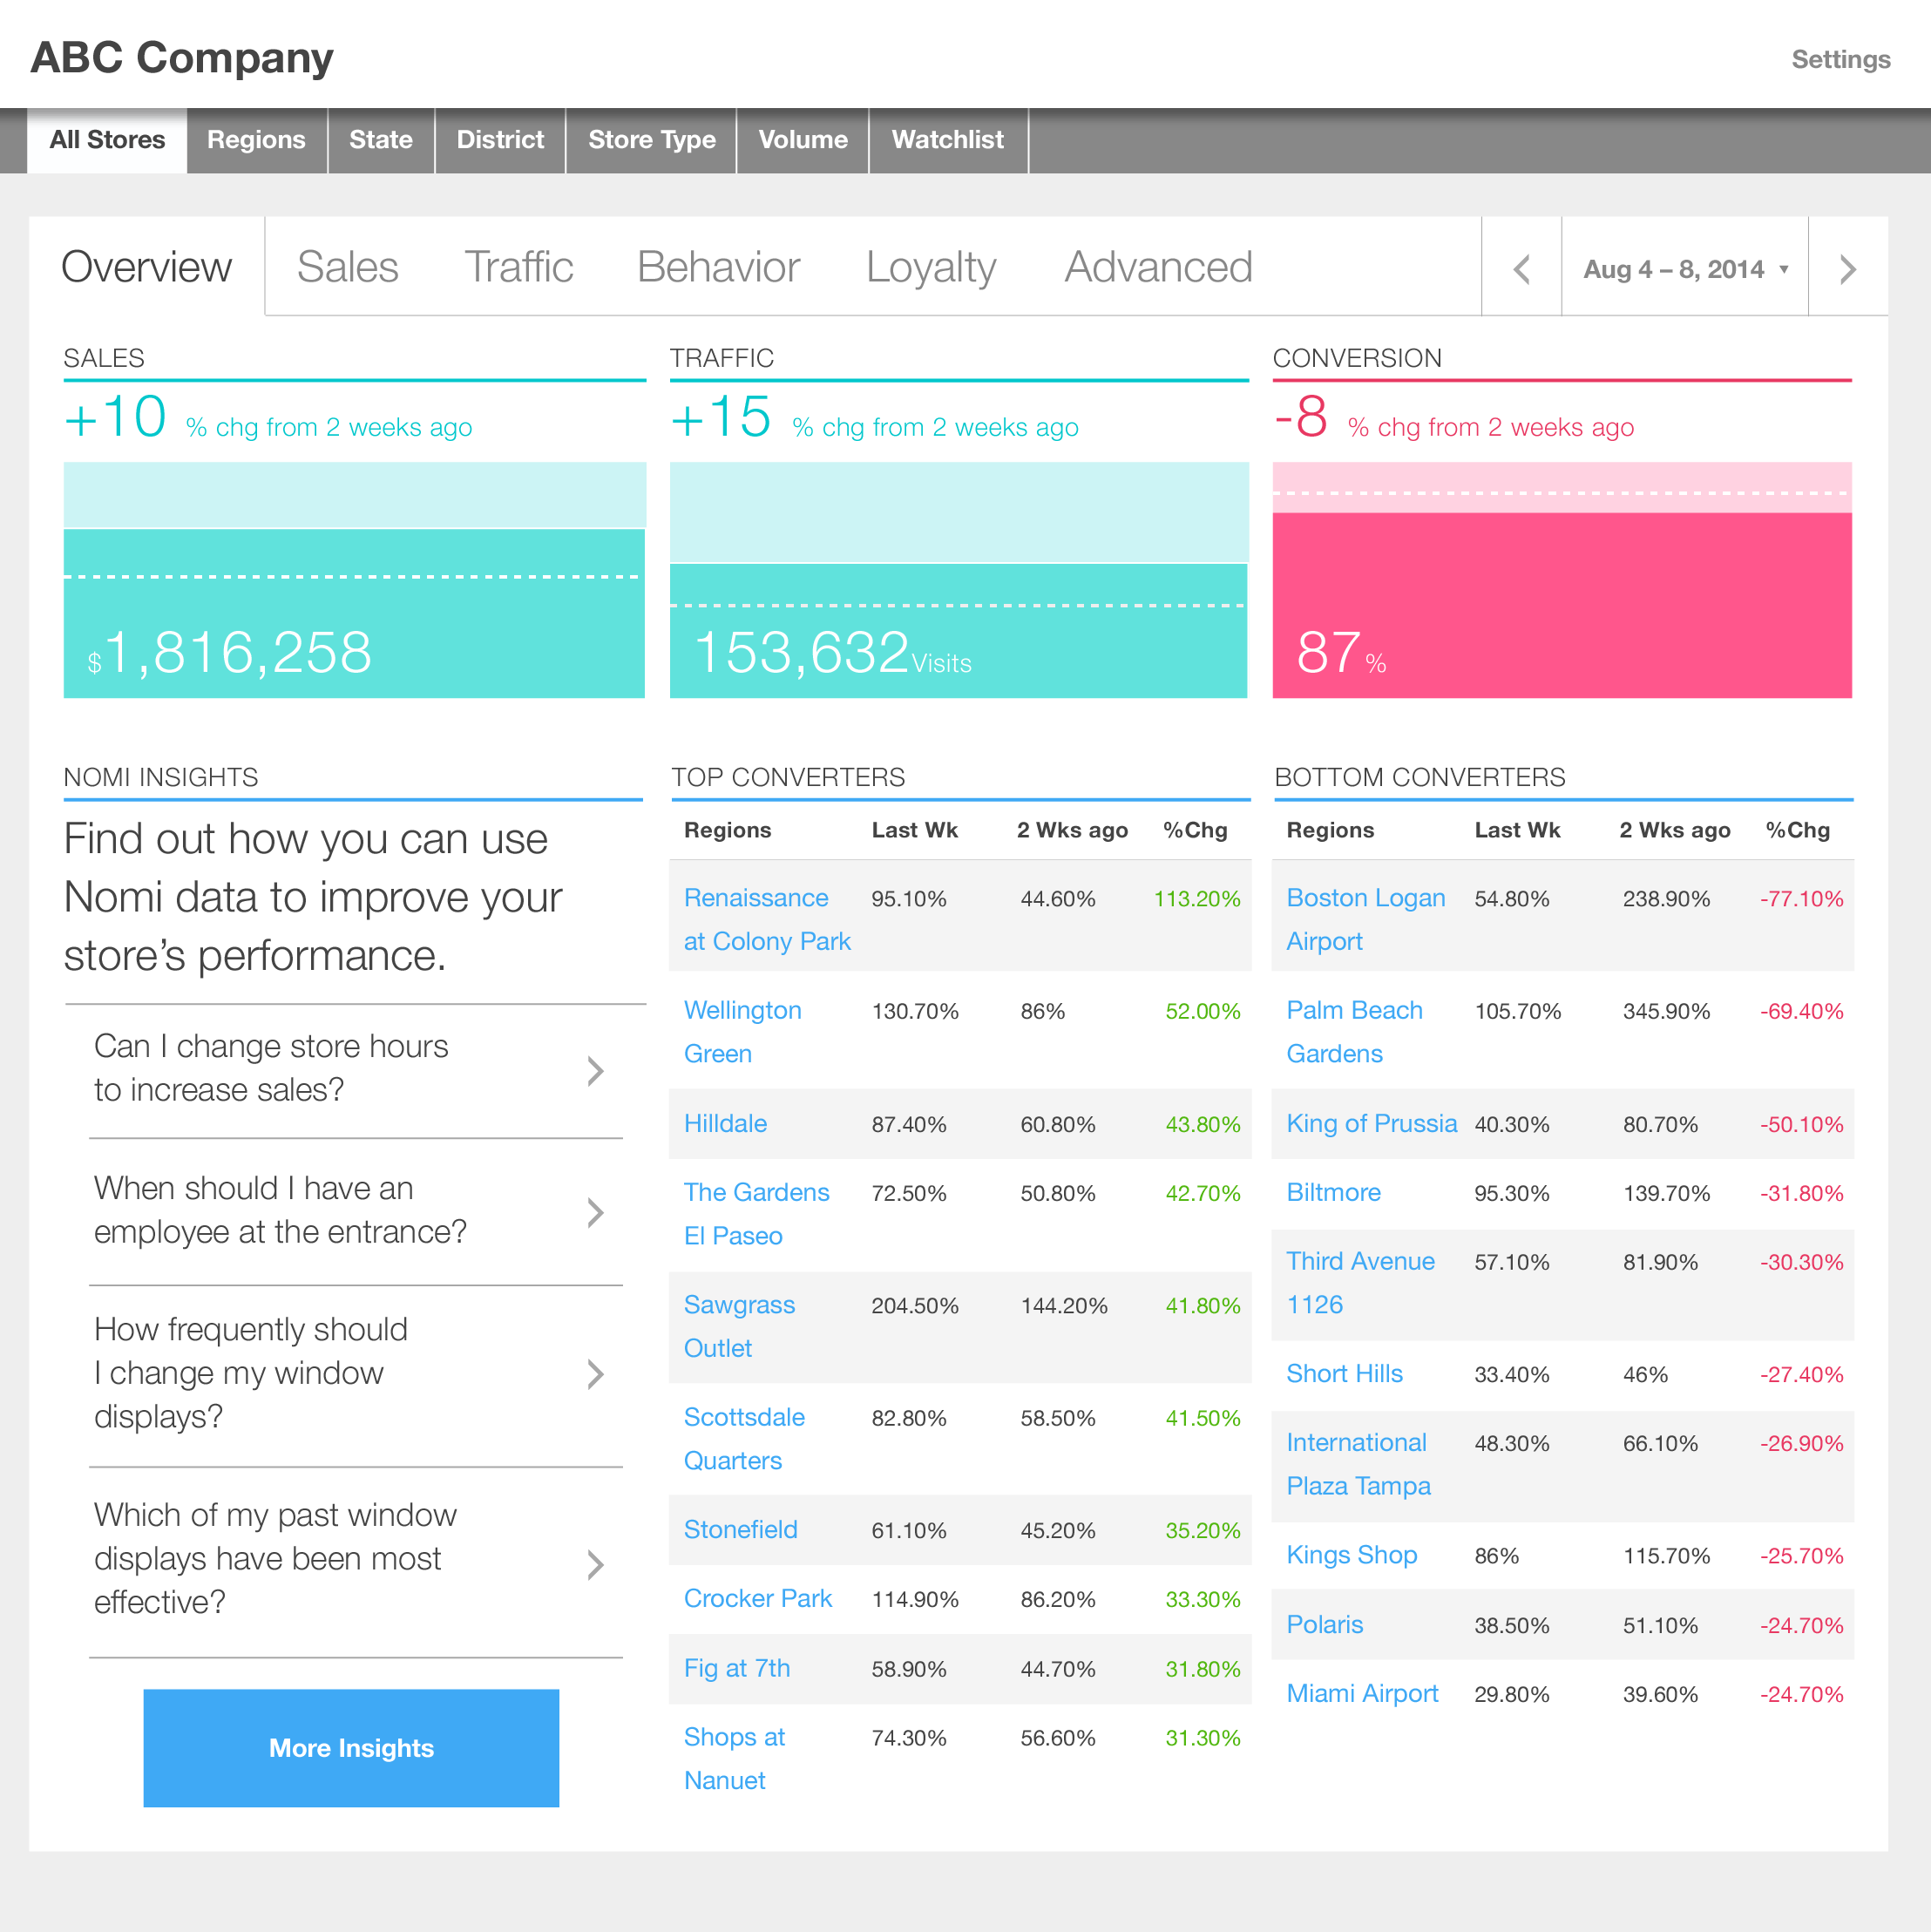
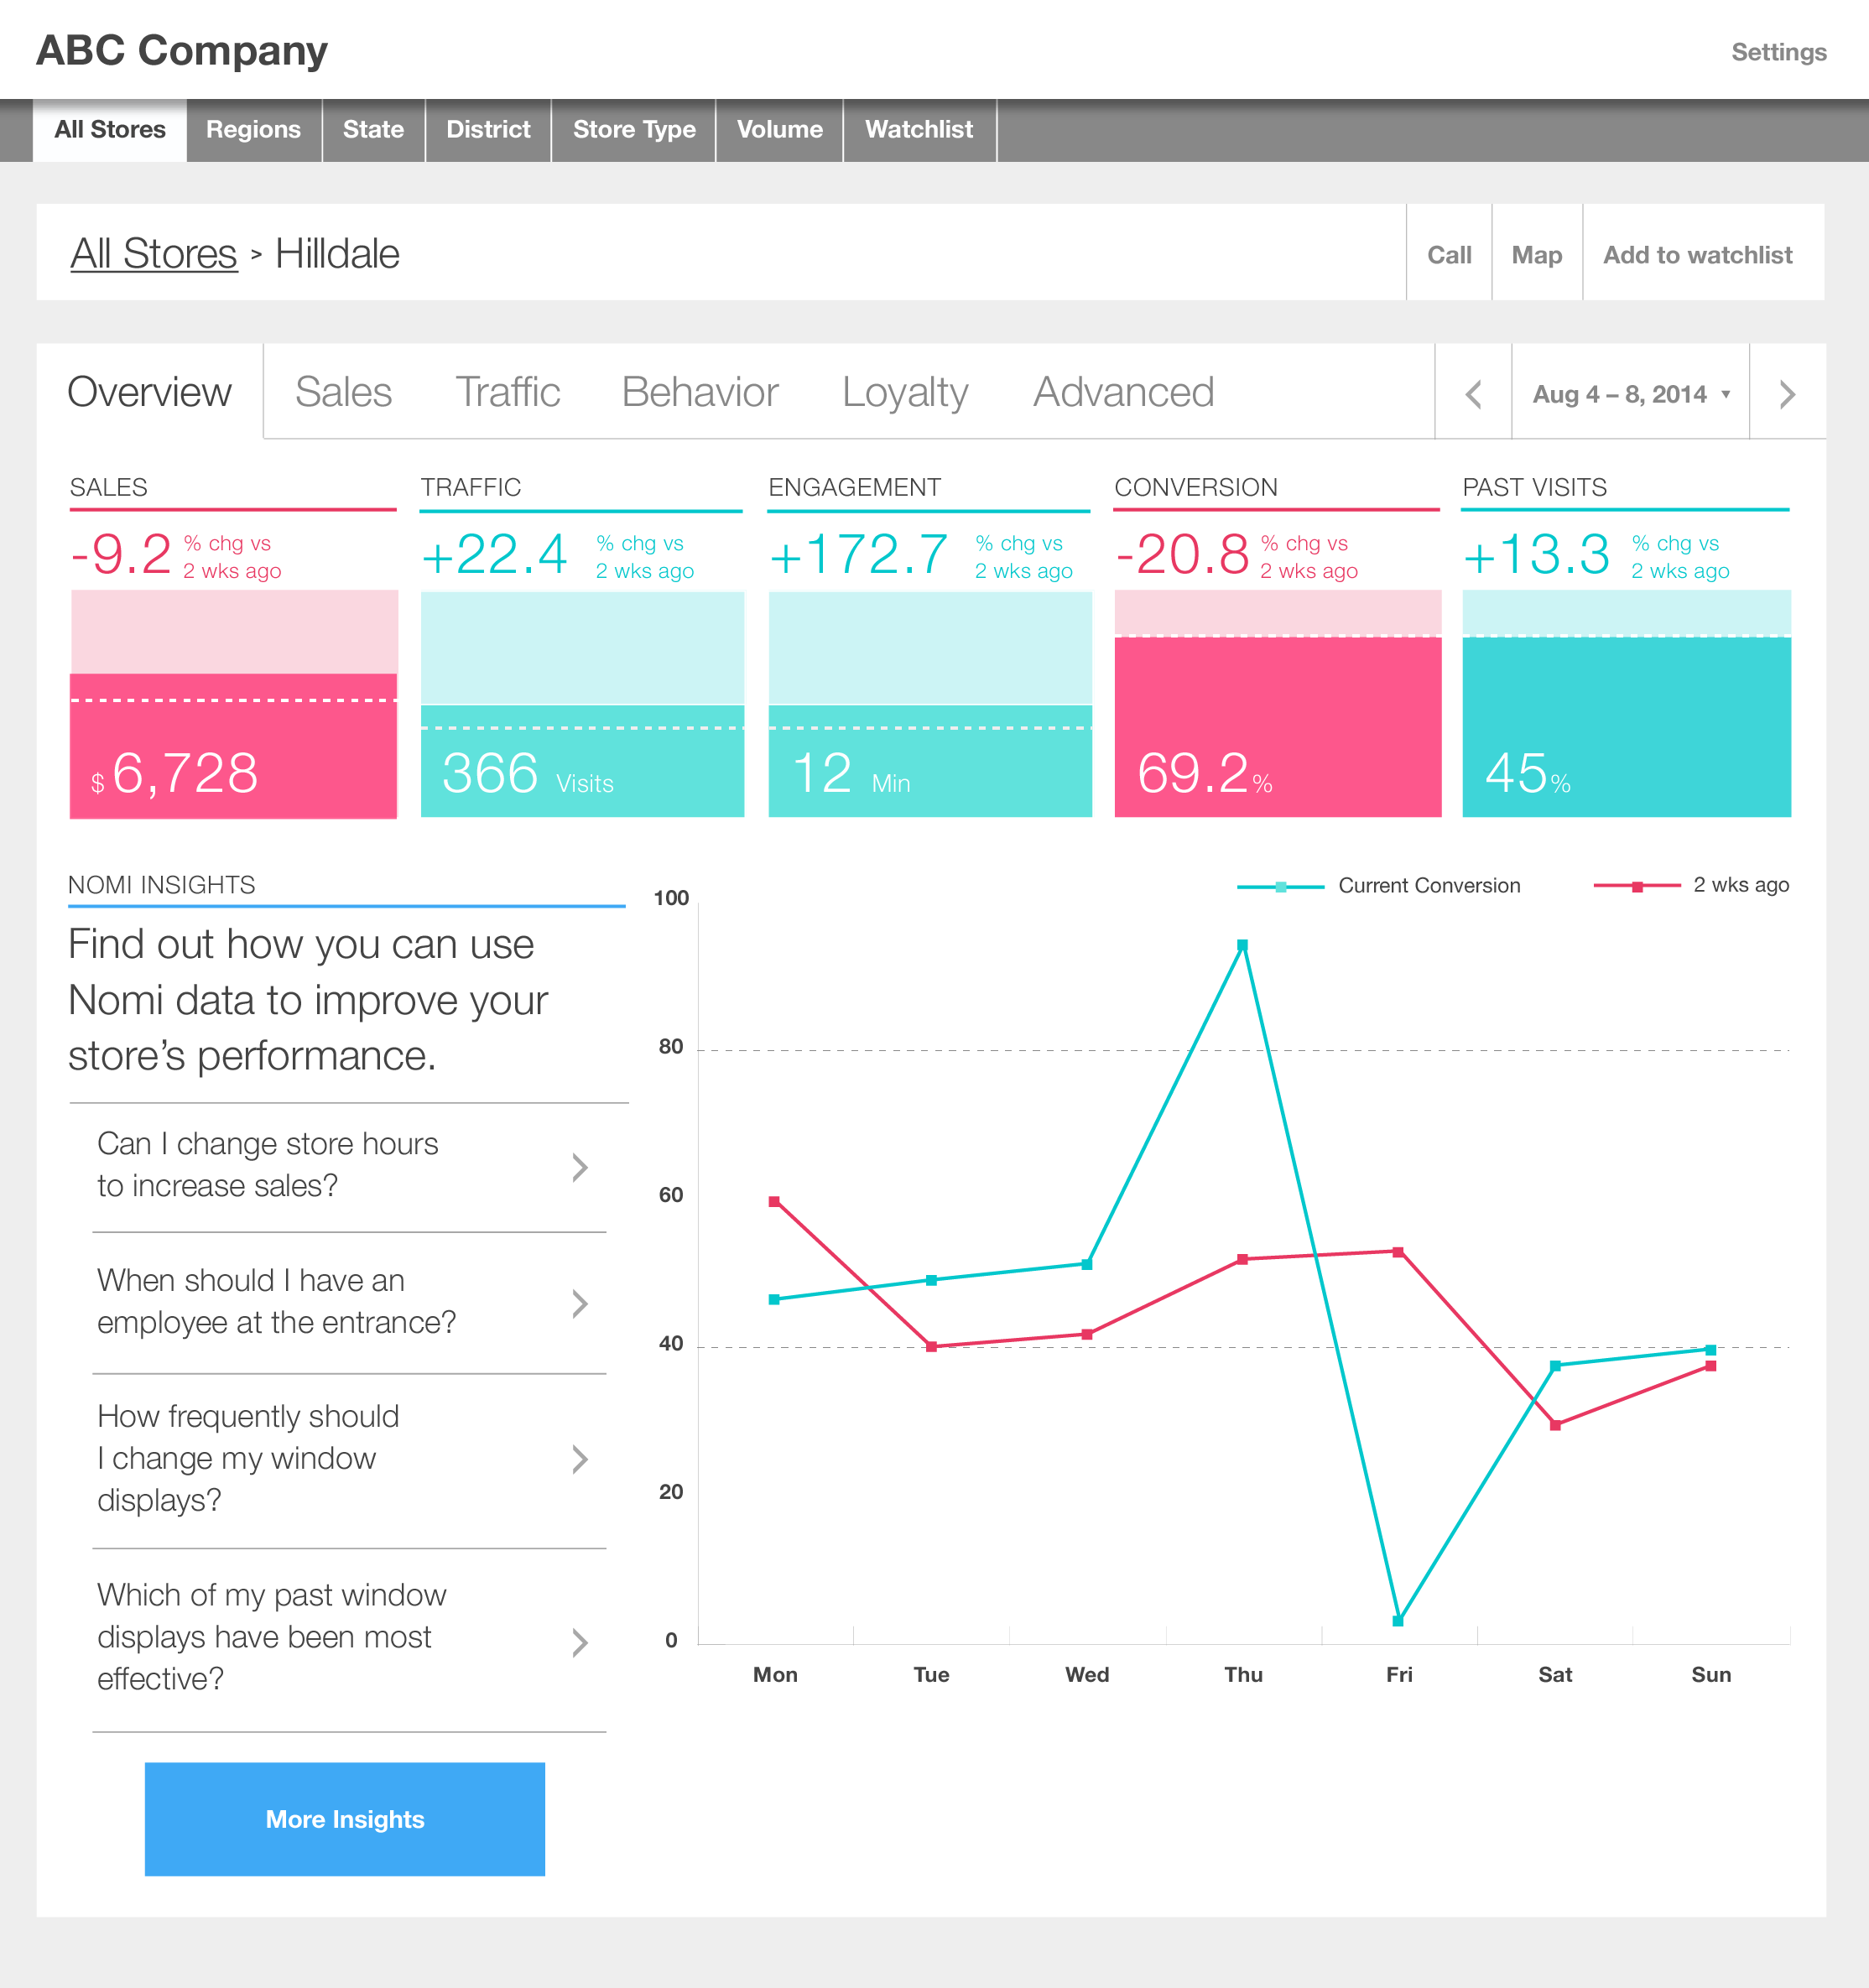
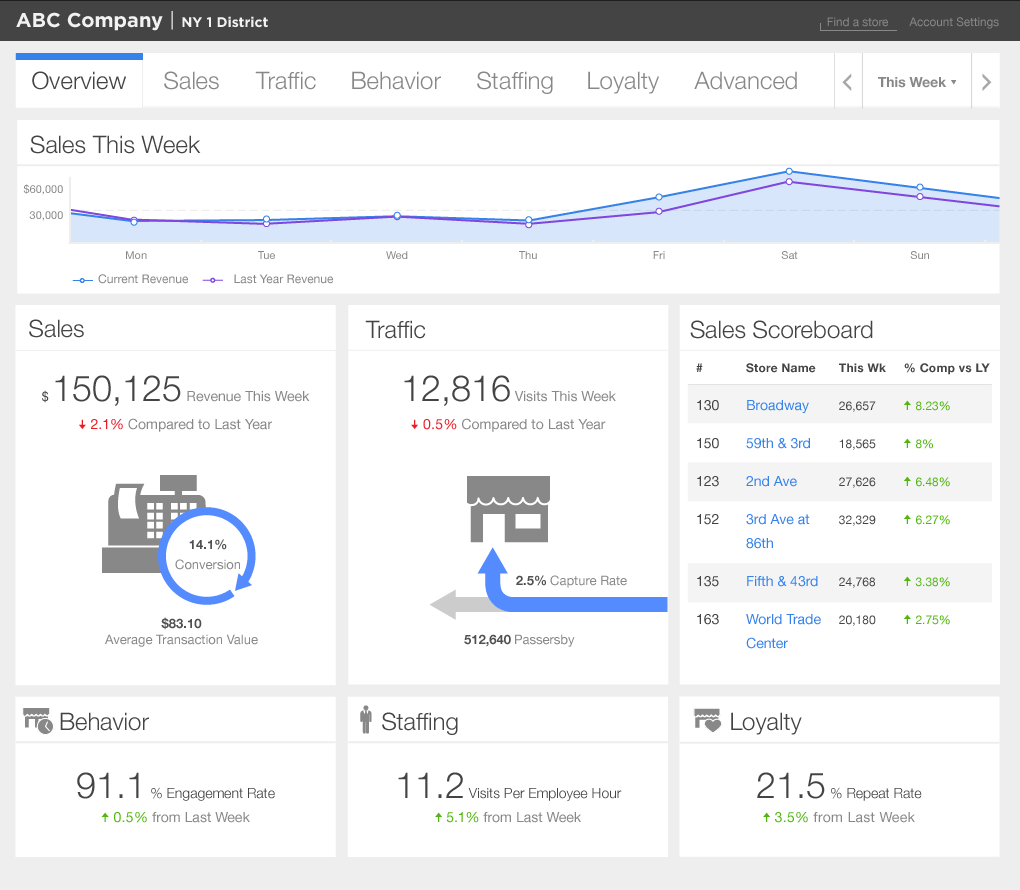
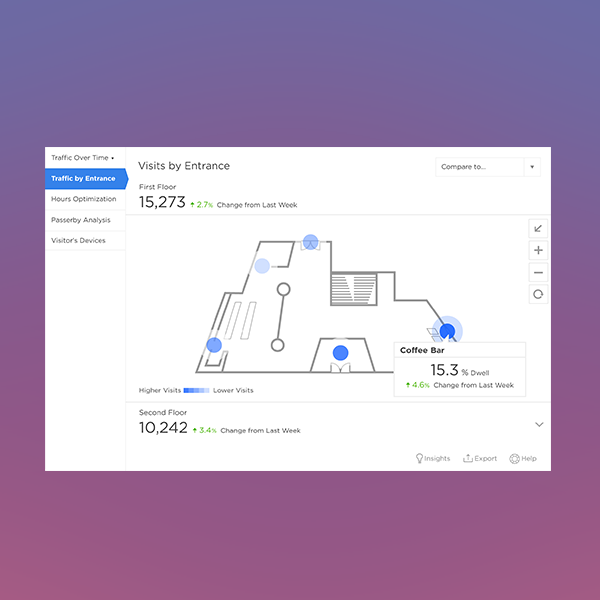
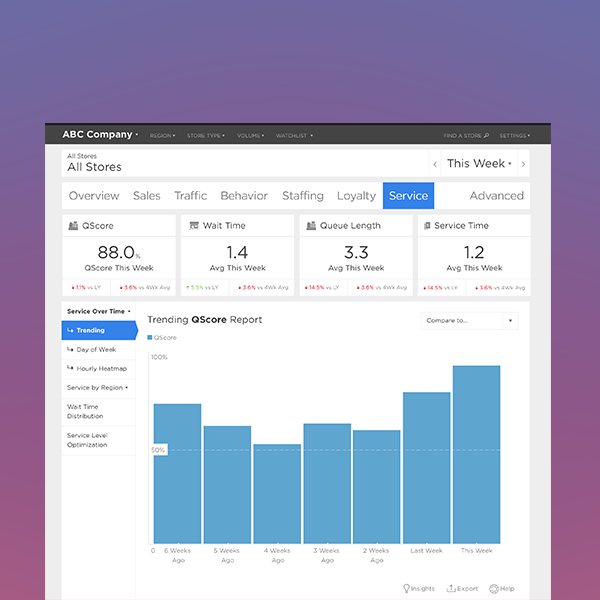
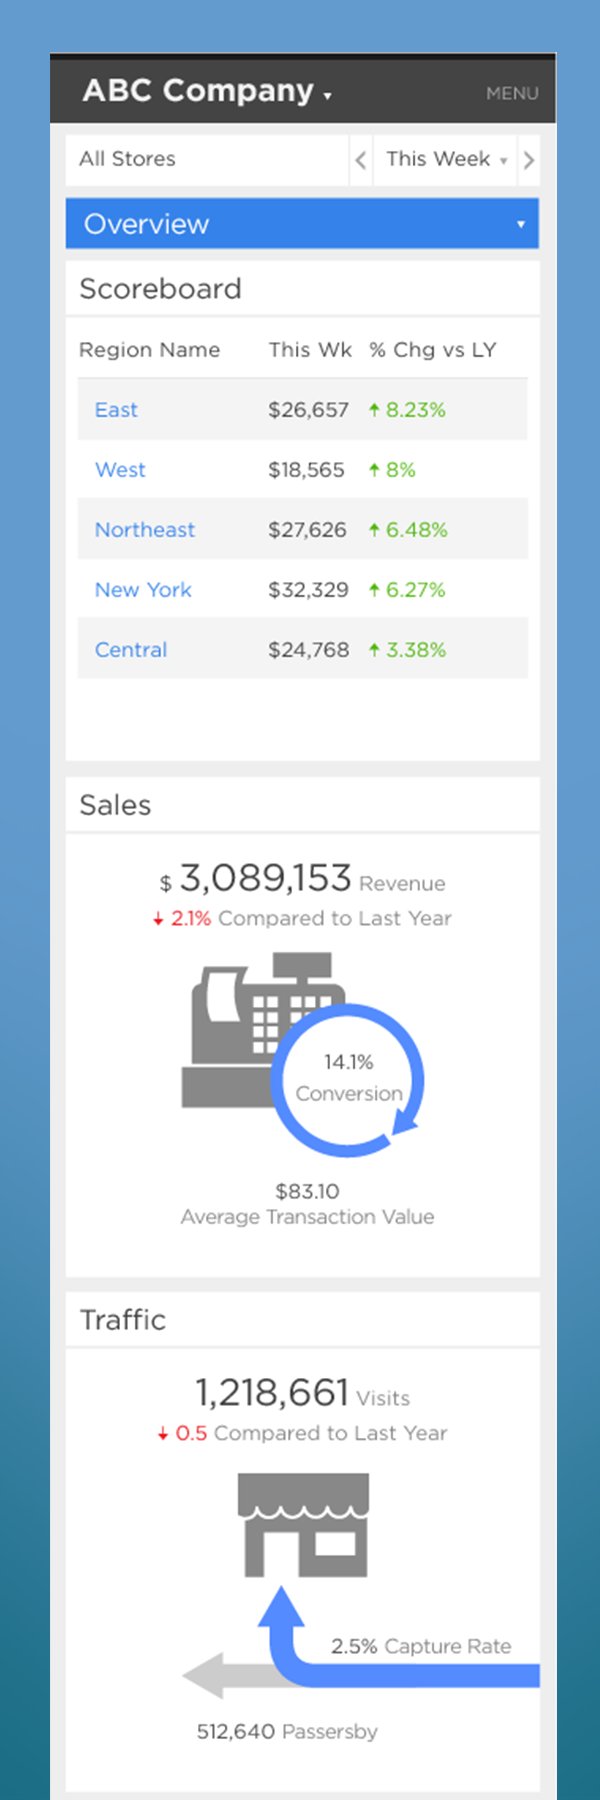
We designed canned reports specifically for the users who want to easily digest the data we present. We give them what we think they need: charts of trending days and hours of highest and average traffic over time and the hours in the day where foot traffic was heavier.
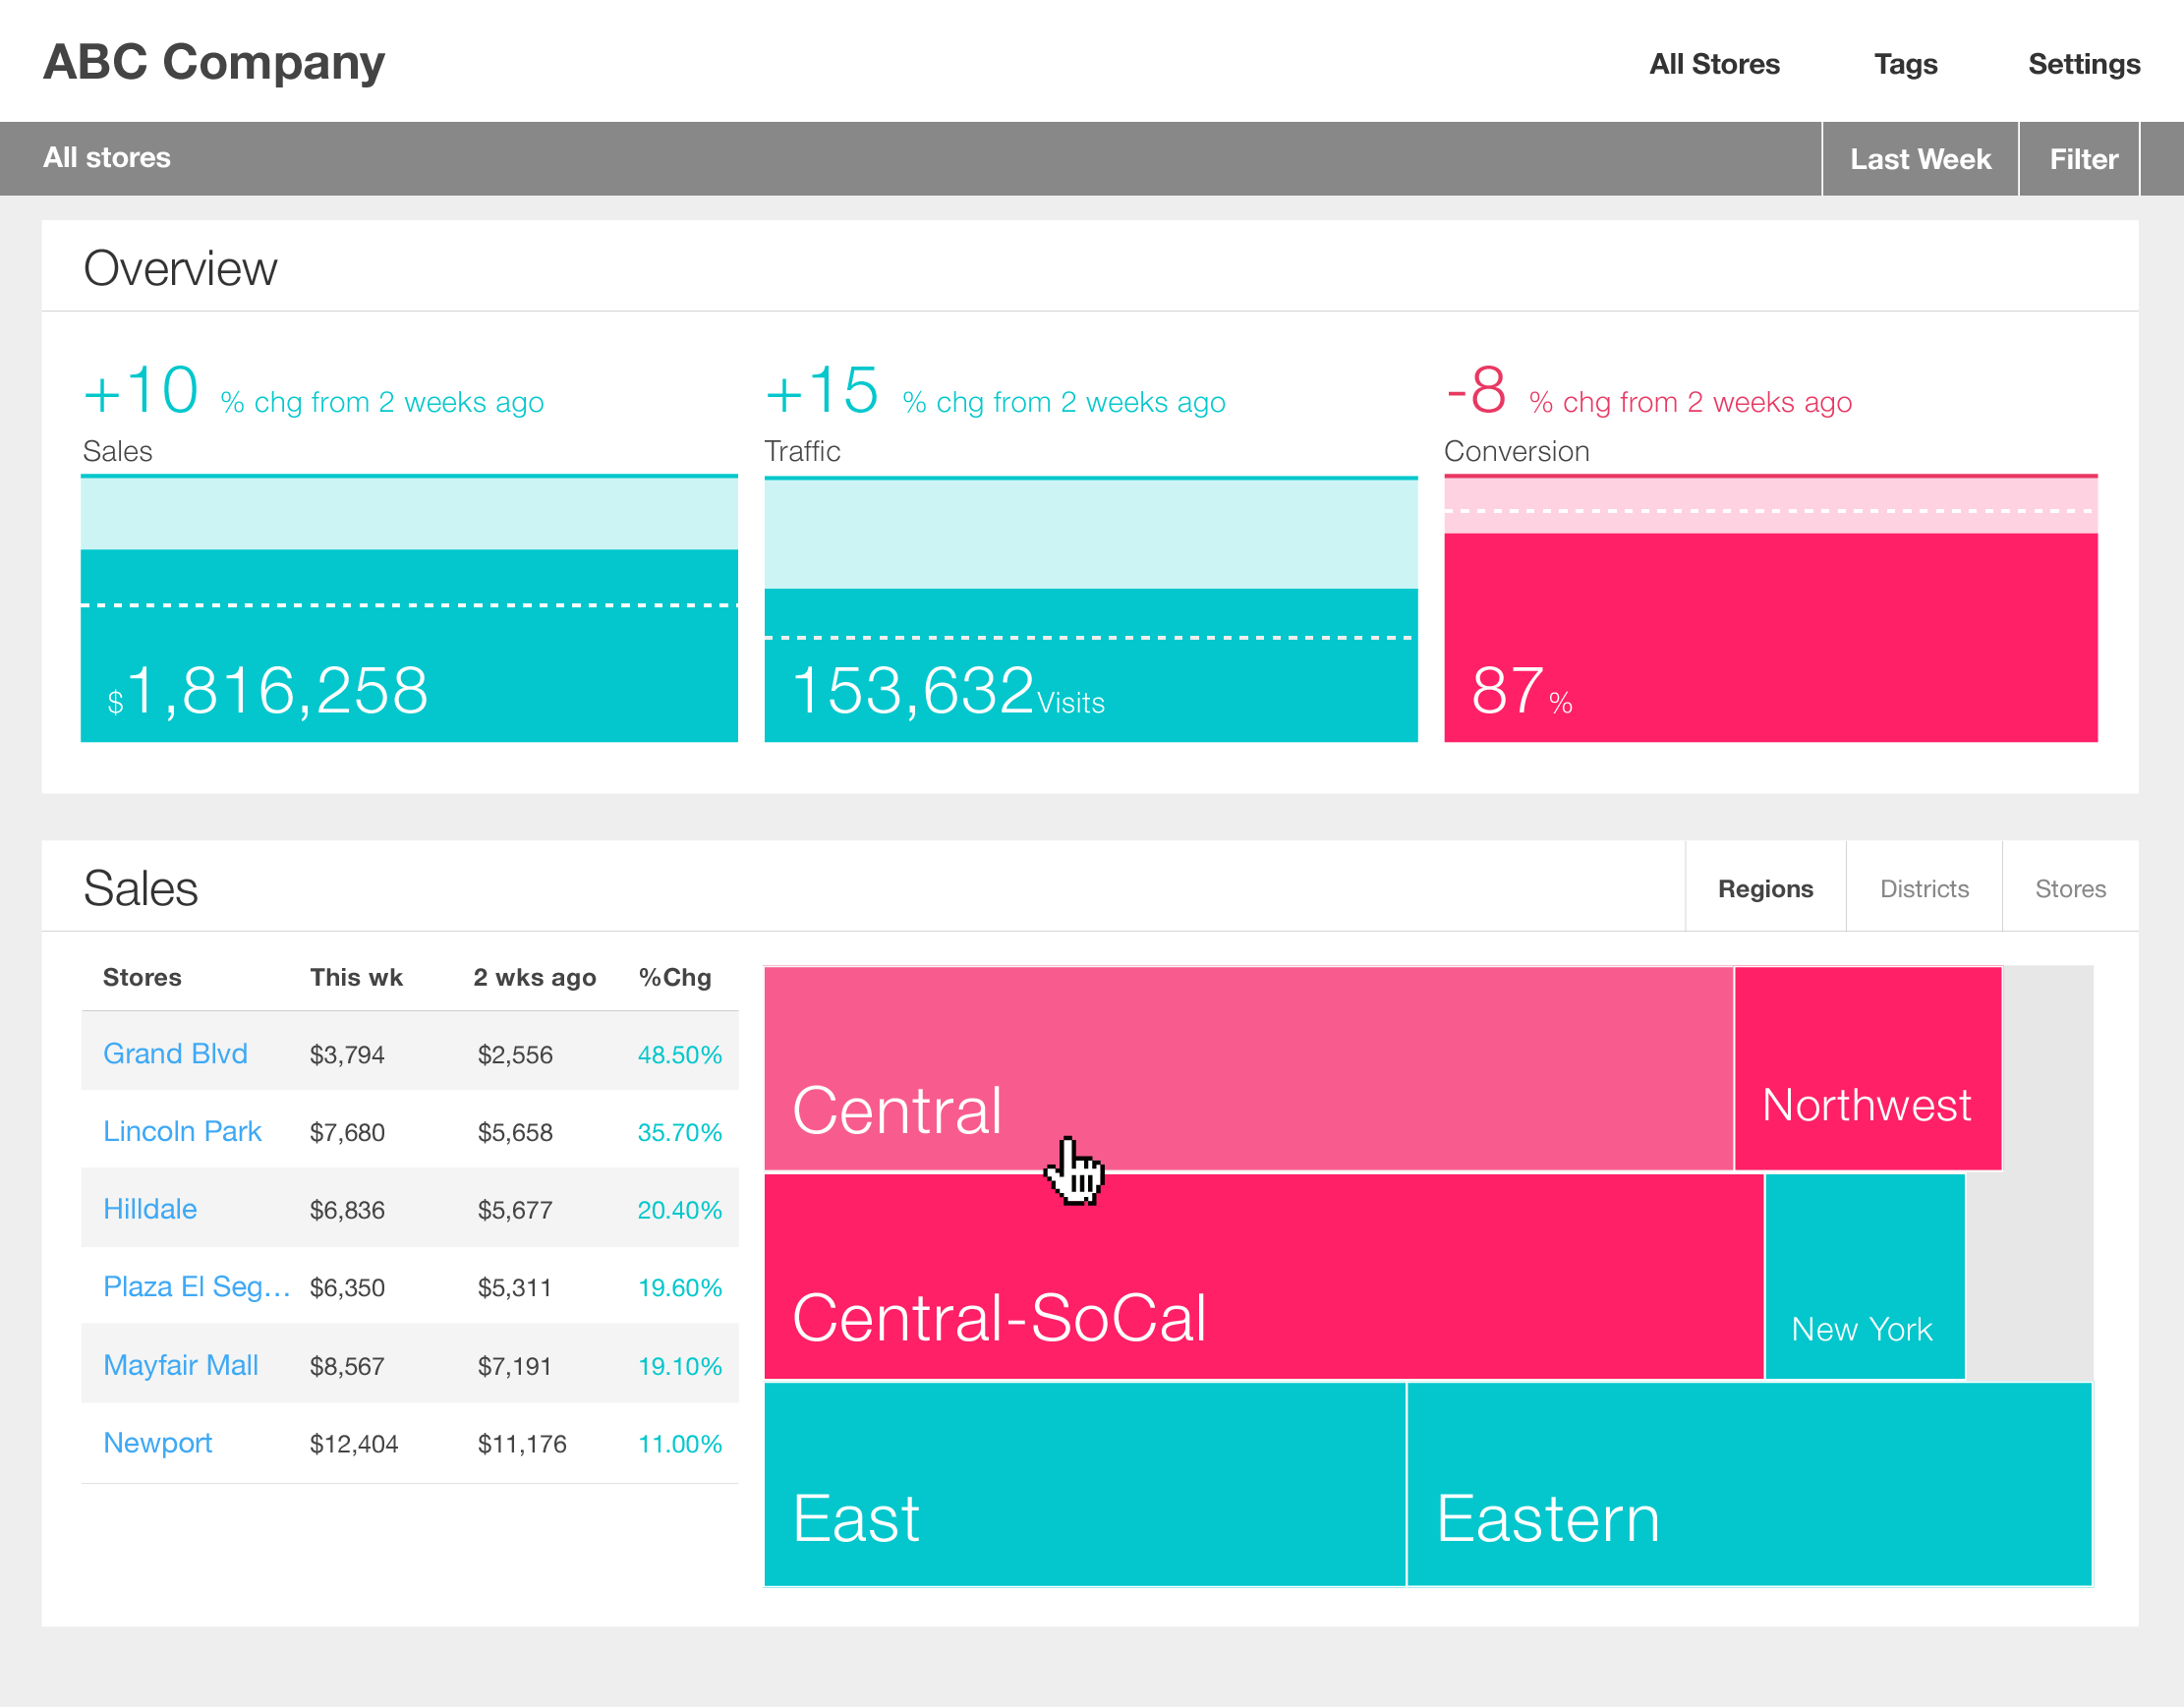
More explorations: